OKO’s founder, Mat Bennett, once wrote about Facebook’s in-app browser over on State Of Digital. There, he encouraged marketers and publishers to stop ignoring what is one of the most-popular and under-reported segments of browsers on the web: Facebook’s in-app browser.
If you’re involved in marketing or monetizing a website that gets Facebook traffic, you’d do well to read the piece in full. But in short, apps like Facebook now frequently open links in their own proprietary browser window, rather than funneling traffic through a web browser like Google Chrome or Firefox. This traffic goes unreported by analytics, might render differently, and could make a mess of your advertising revenue and cookie use.
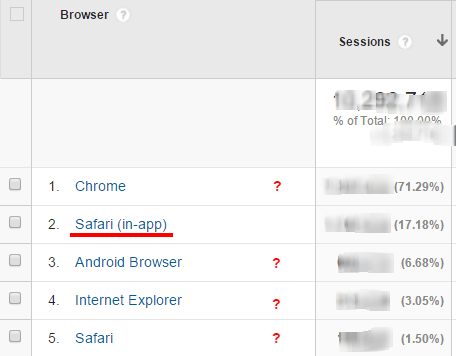
The first step to dealing with the issue — as always — is to measure it. This is a challenge, as Google Analytics doesn’t properly report on in-app browsers. Looking at Google Analytics might lead you to believe that only Safari users use in-app browsers, which is obviously not the case. In-app browsers (more-accurately called “web view windows”) run as a child of whatever the user’s primary browser is. Safari chooses to report this as ‘Safari (in-app),’ whereas other browsers don’t differentiate. A Chrome user viewing your website in-app, for example, will simply show up as using Chrome, even though their experience might be quite different than if they were using the full browser.
As in-app browsers can have a big impact on ad revenue, this is information that we want to be able to access when working with partners on website monetization. The first step is to plug this gap in Google Analytics. We’ll do this using Custom Dimensions.
Custom Dimensions for In-App Browsers
Custom Dimensions are a handy feature on Google Analytics that’s perfect for jobs like this. Adding a custom dimension of in-app browsers will allow you to start tallying up any users of in-app browsers that we are interested in tracking. Here’s how:
In Google Analytics
- Switch to the property where the data will be saved
- Click Admin, then select Custom Definitions, then Custom Dimensions
- Create a new custom dimension as shown here
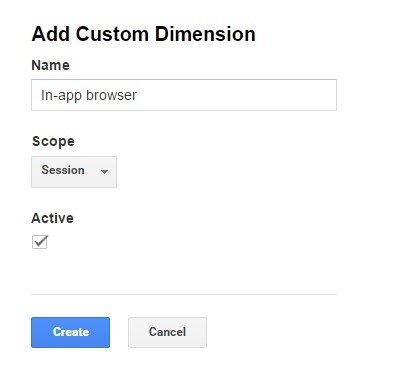
This gives you a way to track the dimension. Take a note of what Dimension number is used when you create this. We now just need to pass the value into Facebook.
On-page changes
In order to pass this value into Google Analytics we need to read the user-agent string, and set the custom dimension. This just needs a small snippet added to the Analytics tag, assuming you’re using GPT tags. Simply add the following line just before ga(‘send’, ‘pageview’);
var ua = navigator.userAgent || navigator.vendor || window.opera;
ga('set', 'dimension1',(ua.indexOf("FBAN") > -1) || (ua.indexOf("FBAV") > -1) ? 'Facebook' : 'None');
Note, if the in-app dimension isn’t the first one you’ve created, then you may need to change dimension1 to match the dimension number created in analytics earlier.
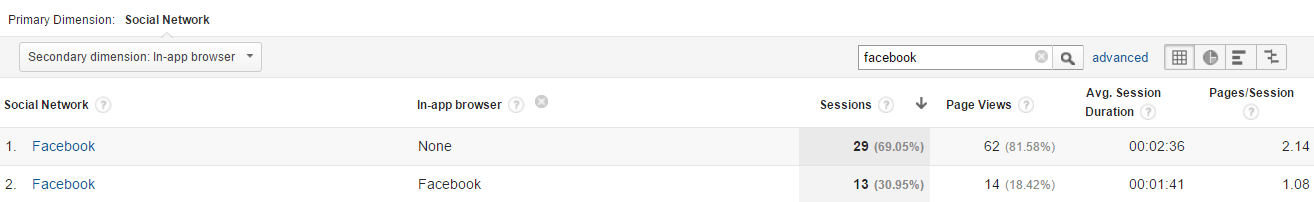
This method allows you to use Add Dimension to show in-app browser use for most reports. For example, here’s a breakdown for traffic referred from Facebook to a test link that we’ve shared. Having this data available as a dimension allows you to apply it to many report types.
This method allows you to use Add Dimension to show in-app browser use for most reports. For example, here’s a breakdown for traffic referred from Facebook to a test link that we’ve shared. Having this data available as a dimension allows you to apply it to many report types.
You could, for instance, compare bounce rates, visitor loyalty or AdSense/Adx revenue performance.
Final thoughts
The script snippet provided only detects Facebook’s in-app browser, but the logic can be applied to the webview windows opened by other mobile apps as well. You simply need to find the unique strings reported in the user-agents of those particular apps.
For those involved in ad-serving, the same technique can be used to target in-app browsers in DFP, allowing you to measure ad performance and send more targeted impressions to those users. Learn how to do that here.
For more technical tips and tricks on how to make sense of the complicated world of web monetization, read more on our blog. Or, if you’re ready for a monetization partner to take your revenue to the next level, reach out to us any time.